When troubleshooting DNS, we usually default to tools like Dig and NSLookup to identify issues. However, sometimes we require more information and granularity when trying to identify DNS problems, and Wireshark can provide us with that. Below, we will discuss some simple filters that can be applied to a Wireshark capture (PCAP) to easily identify DNS and then some ways we can filter for specific types of issues.
Simple Filters:

Within any given Wireshark capture, you can simply use the DNS filter. This will allow you to clearly see all DNS traffic transmitted.

DNS can also be filtered using the port/protocol. The above filter will search for all DNS UDP traffic (over port 53). Although UDP 53 is the standard port and protocol used, not all DNS is sent using it (as you will see in the next command).
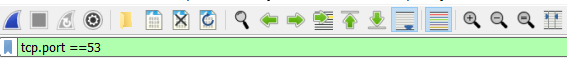
Although DNS is not transmitted over TCP by default, under certain circumstances it can be. If a standard DNS packet exceeds 512 bytes, the packet is truncated and transmitted over TCP. As this is ‘none standard’, it is often overlooked and can cause issues if ACLs/Firewalls are not configured correctly.
Searching via Domain:
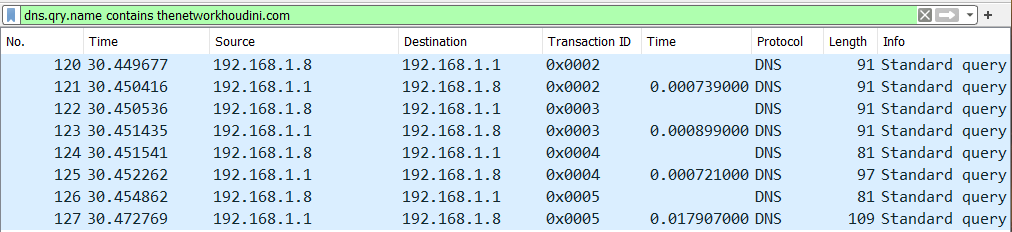
Ok, we now know how to search for standard DNS traffic in Wireshark. But what if we need to filter by a specific domain? Can we do that? Of course! By using the filter dns.qry.name contains <domain of interest>. This then allows us to filter DNS traffic based on the domain should we be investigating a specific entry:
DNS Errors:
Identifying errors in DNS packets can be challenging while examining large captures. Reducing them to specific packets of interest can significantly enhance our ability to analyze the encountered errors. When analyzing a response packet, we observe specific flags that indicate errors. By navigating to the Domain Name Systems > Flags section of a DNS response packet, we observe the reply codes flag:
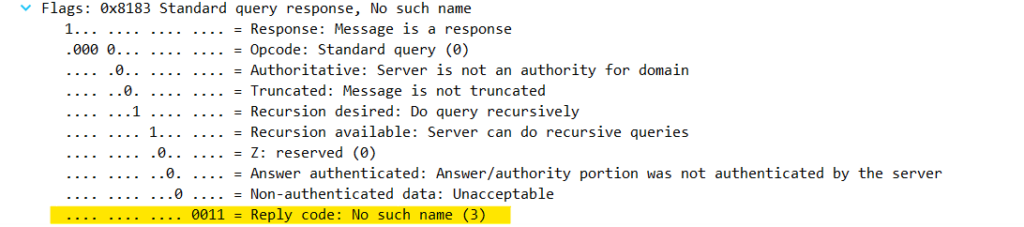
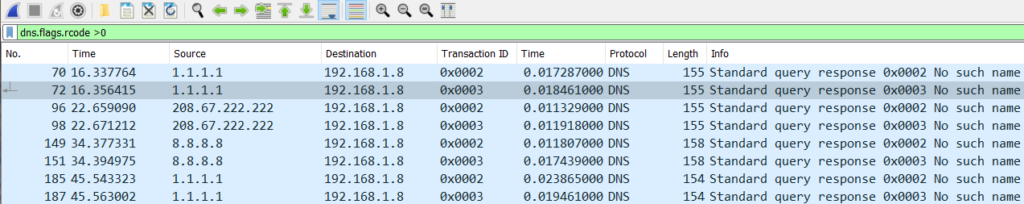
Anything other than a 0 in that field is classified as an error. Therefore, you can use a filter to display anything greater than 0: dns.flags.rcode > 0. This filter should display all the response packets in the tracefile that had errors:
DNS Retransmissions:
DNS retransmissions may cause various issues on a network, such as latency. There are a few ways in which these retransmissions can be identified.
With any DNS request (or response), a Transaction ID is generated, we can observe this by navigating to the Domain Name System in the packet:
![]()
DNS requests and their corresponding responses should contain the same Transaction ID. Although a capture of sufficient size could theoretically have duplicate IDs, these should only really be seen when DNS fails and a retransmission occurs (as these will use the same ID). When examining the DNS response of a retransmitted packet, we observe a Retransmission Expression set to True:
![]()
Using this expression, we can set a filter : dns.retransmission == 1, which should filter all DNS retransmissions in the capture:
![]()
DNS Latency:
As mentioned above, Transaction IDs are attached to each DNS request (and corresponding response). This is a way of identifying which response pertains to a particular DNS request.
Within a response packet under the Domain Name System , you should see the Time expression, which is the response time to the corresponding DNS query:
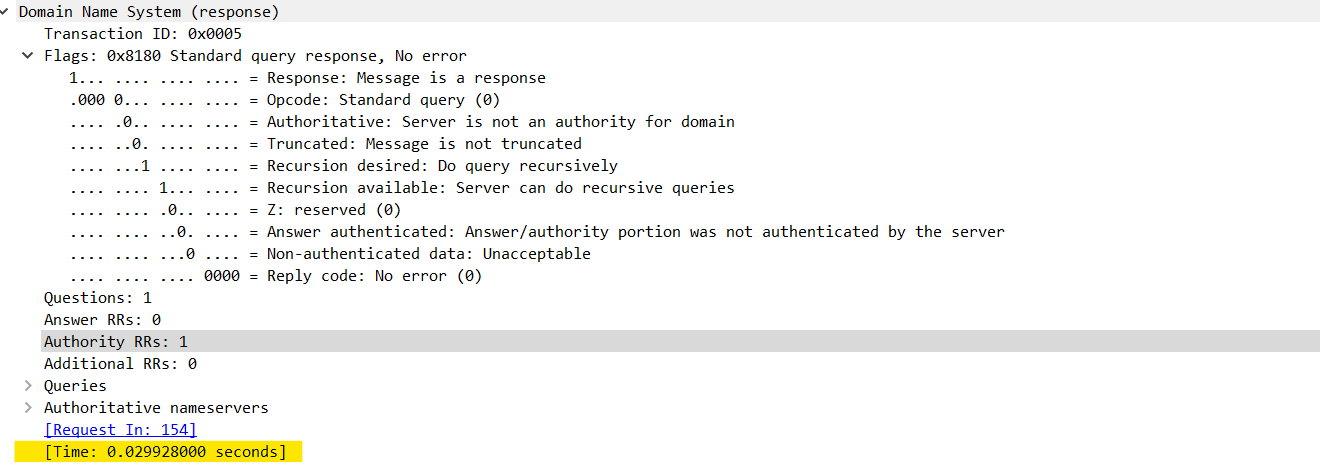
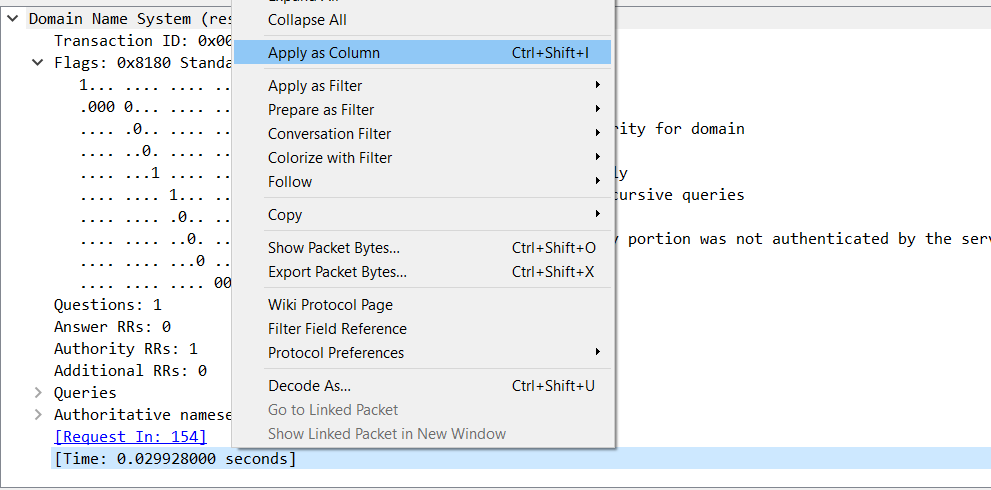
Great! We can see the response times for a given request. But what if we want to look at them all together from a holistic view? You can create a new column for TIME by right-clicking and adding it as a column in the response packet. This will show all the response times (you can also do this for a multitude of values such as the transaction ID).
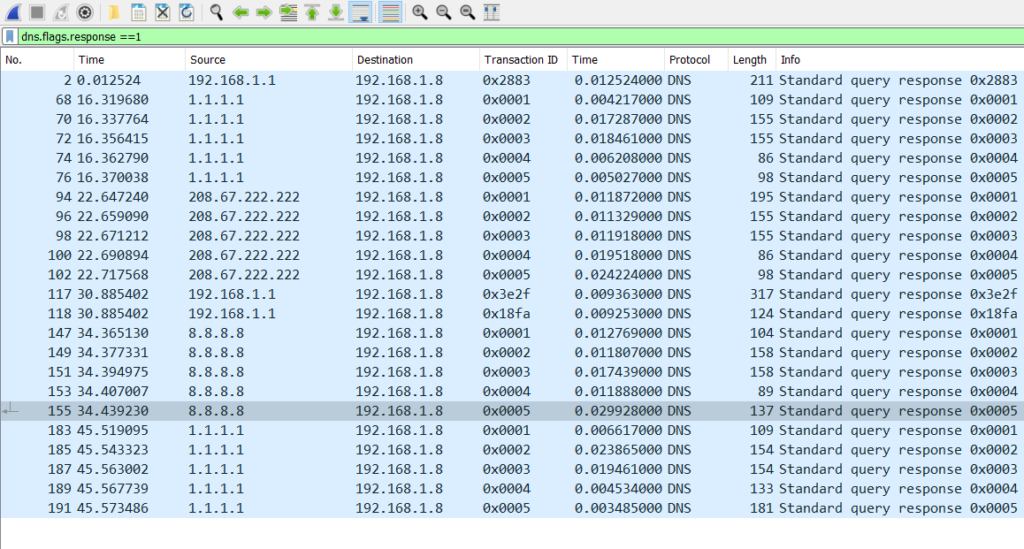
This will give us a TIME column, which should display all DNS response times. By using the filter dns.flags.response == 1, we will see all the responses in the file, including response times for every DNS request.
Ok, but what if we want to see collective data rather than just individual requests? This can be achieved by navigating to Statistics > DNS. Within this view, we can see the request-response time, which will give us an average/min/max value (in milliseconds) of this.
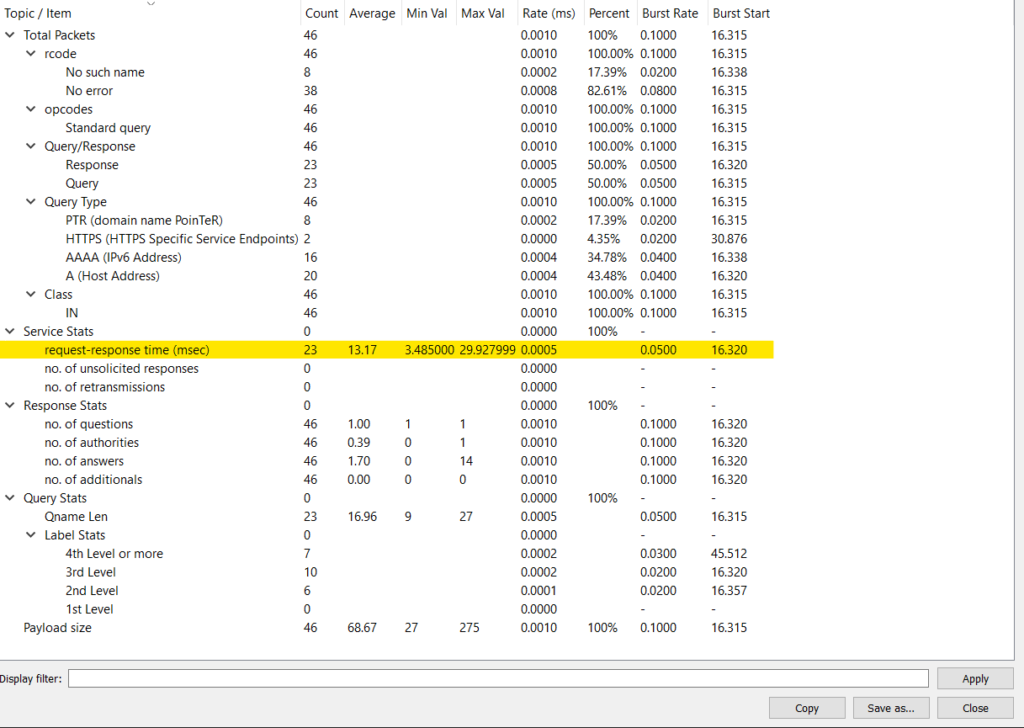
We can then run filters to test the performance of the resolvers used. Using the display filter on this page to filter by the IP of the recursive resolver (using the filter ip.addr == ), which can then be used to compare different DNS resolvers and the response times from our network.
In conclusion, while we usually troubleshoot DNS issues with Dig and Nslookup, sometimes we need more information and to actually see the traffic on the wire. This is where the value of using a tool like Wireshark really shines. While we have discussed some filters that help in most scenarios, Wireshark is an excellent tool and almost anything in a DNS packet can be filtered if required.
Thanks for reading!